Psychrometric chart PDF
A chart to print, draw on with a straightedge and read values from. Vector PDF that stays sharp at any zoom. Free, no sign-up.
-
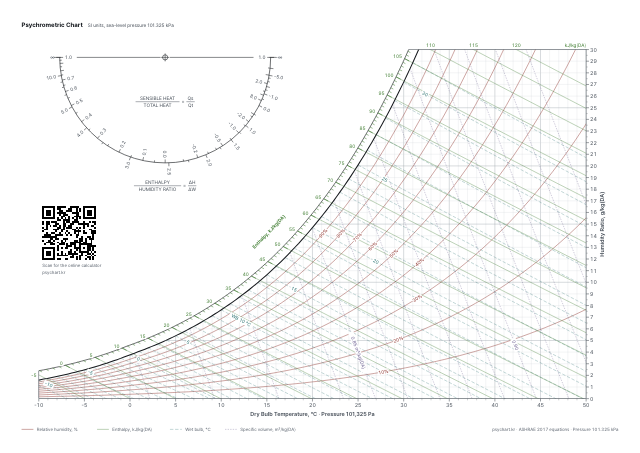
Standard color
Same colors as the calculator: relative humidity in brown, enthalpy in green, wet bulb in dashed teal, specific volume in dotted violet.
-
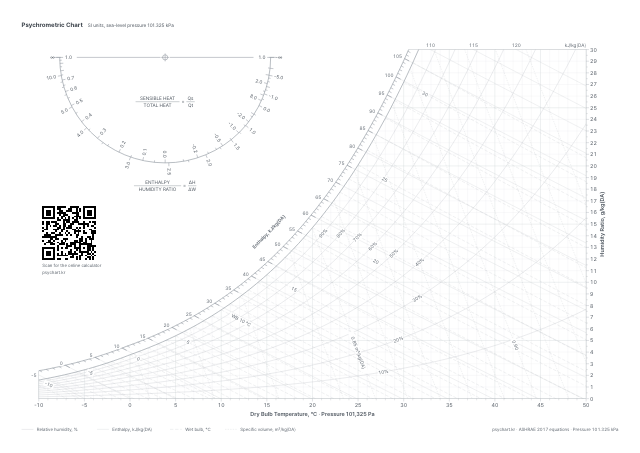
Light (for hand plotting)
All lines in thin light gray, so pencil and pen lines stand out. Numbers stay dark enough to read.
-
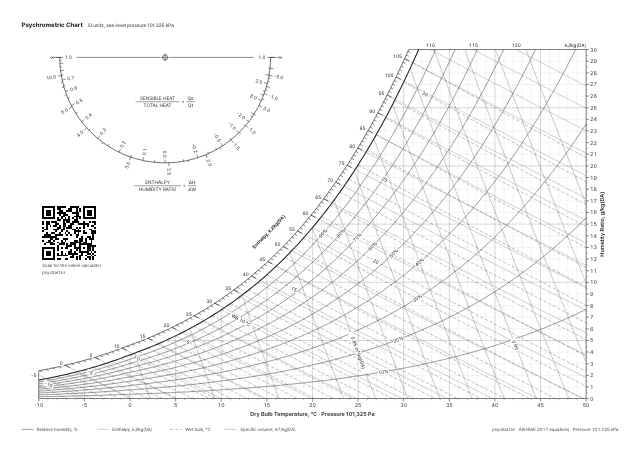
Black and white
For monochrome printers. Relative humidity is a heavier solid line, enthalpy a thin solid line, wet bulb long dashes and specific volume short dots.
What is on the chart
- Range: dry bulb -10 to 50 °C, humidity ratio 0 to 30 g/kg(DA)
- SI units (enthalpy in kJ/kg(DA)), pressure 101.325 kPa (sea level)
- Fine ticks: dry bulb 1 °C, humidity ratio 0.5 g/kg, enthalpy 1 kJ/kg, wet bulb 1 °C, RH 10 %, specific volume 0.01 m³/kg
- Protractor at top left: sensible heat factor (SHF) and enthalpy / humidity ratio (ΔH/ΔW)
- Equations: ASHRAE Handbook Fundamentals 2017, the same as this site's calculator
How to print
- In the print dialog choose "Actual size" (100 %) and landscape. "Fit to page" shrinks the chart slightly.
- No A3 printer? Use the A4 file. Printing the A3 file on A4 makes the text and ticks small.
- Everything stays at least 10 mm from the edge, so home printers do not cut it off.
For exam practice
- Take the slope of the sensible heat factor line from the protractor at top left and slide it to the state point with two set squares.
- Check values you read off the chart by entering the same two values in the calculator. Values read by eye can differ in the first decimal place.
Did not find your question? Ask on the community board or send it with "Feedback" at the top. Last updated 2026-10-07.